- Company
-
Investor Centre
- Our Performance ASX Announcements Investor Presentations Key Financials News Results Centre Share Price
- Shareholder Information Annual General Meetings Dividends/Special Distributions Financial Calendar Green Finance Framework Recall Demerger Shareholder Services Shareholder Communication Options TCFD Disclosure
- Corporate Governance
-
Sustainability
- Our Sustainability Strategy Our 2025 Sustainability Targets Our 2020 Sustainability Goals Our 2020 Goal Achievements Our net-zero roadmap
- Reporting & Governance ESG Navigator Global Reporting Initiative Index UN Global Compact Sustainability Governance Sustainability Review Sustainability Case Studies
- Contact us


Brambles manages its capital structure to maintain a solid investment grade credit rating. During the financial year ended 30 June 2015, Brambles held investment-grade credit ratings of BBB+ from Standard & Poor’s and Baa1 from Moody’s Investors Service.
In determining its capital structure, Brambles considers the robustness of future cash flows, the potential funding requirements of its existing business, growth opportunities and acquisitions, the cost of capital, and ease of access to funding sources. Initiatives available to Brambles to achieve its desired capital structure include adjusting the amount of dividends paid to shareholders, returning capital to shareholders, buying back share capital, issuing new shares, selling assets to reduce debt, varying the maturity profile of borrowings and managing discretionary expenses.
Brambles’ treasury function is responsible for the management of certain financial risks within Brambles. Key treasury activities include liquidity management, interest rate and foreign exchange risk management, and securing access to short and long-term sources of debt finance at competitive rates. These activities are conducted on a centralised basis in accordance with Board policies and guidelines, through standard operating procedures and delegated authorities.
These policies provide the framework for the treasury function to arrange and implement lines of credit from financiers, select and deal in approved financial derivatives for hedging purposes, and generally execute Brambles’ financing strategy.
Brambles’ policies with respect to interest and exchange rate risks and appropriate hedging instruments are described below. Further information is contained in Note 25 of the Financial Report on Pages 70 to 76, including a sensitivity analysis (Page 72) with respect to these financial instruments.
The Group uses standard financial derivatives to manage financial exposures in the normal course of business. It does not use derivatives for speculative purposes and only transacts derivatives with relationship banks. Individual credit limits are assigned to those relationship banks, thereby limiting exposure to credit-related losses in the event of non-performance by any counterparty.
Brambles funded its operations during the 2015 financial year primarily through retained cash flow and borrowings. Brambles generally sources borrowings from relationship banks and debt capital market investors on a medium-to-long-term basis.
There were no new debt capital market issuances during the Year. Bank borrowing facilities were either maintained or renewed throughout the Year. These facilities are generally structured on a multi-currency, revolving basis with maturities ranging to December 2019. Borrowings under the facilities are floating-rate, unsecured obligations with covenants and undertakings typical for these types of arrangements.
The table below shows the maturity profile of the Group’s committed borrowing facilities and outstanding bonds, including the percentage due in each 12-month maturity period.
Maturity Profile of Committed Borrowing Facilities and Outstanding Bonds (% of total committed credit facilities)
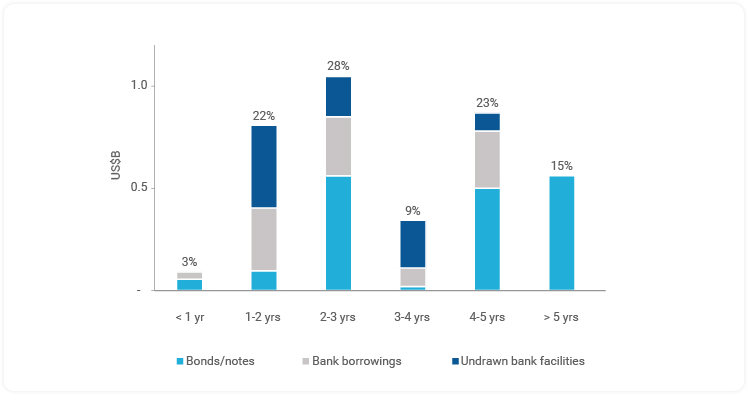
Brambles’ liquidity policy requires, among other things, that no more than 25% of total committed credit facilities mature in any rolling 12-month period. While the two to three-year maturity profile is slightly above this policy, action will be taken to refinance credit facilities to bring the profile within policy.
Net Debt and Key Ratios
Brambles’ financial policy is to target a net debt to EBITDA ratio less than 1.75 times. Key financial ratios continue to reflect the Group’s strong balance sheet position and remain well within the financial covenants included in Brambles’ major financing agreements, with net debt to EBITDA at 1.75 times (2014: 1.59 times) and EBITDA interest cover at 13.7 times (2014: 13.2 times). If EBITDA for all acquisitions completed during the Year was shown pro rata over a full year, Brambles' 2015 net debt to EBITDA ratio would be 1.74 times.
Net debt was US$2,688.9 million at 30 June 2015, up US$327.2 million from 30 June 2014, primarily reflecting the Ferguson Group acquisition.
At 30 June 2015, Brambles had committed credit facilities including bonds and notes totalling US$3,722.6 million. Undrawn committed borrowing capacity totalled US$930.2 million, a decrease of US$1,195.0 million from June 2014, reflecting funding drawn down for the Ferguson acquisition, bond repayments and foreign exchange impacts.
The average term to maturity of Brambles’ committed credit facilities as at 30 June 2015 was 3.9 years (2014: 4.1 years). In addition to these facilities, Brambles enters into operating leases for office and operational locations and certain plant and equipment to achieve flexibility in the use of certain assets. The rental periods vary according to business requirements.
Brambles has a progressive dividend policy. Under this policy, the Group seeks to maintain or increase dividends per share each year, in Australian cents, subject to its financial performance and cash requirements. The Board has declared a final dividend for 2015 of 14.0 Australian cents per share, in line with the previous interim dividend and up 0.5 Australian cents per share on the previous final dividend. The 2015 final dividend is payable on 8 October 2015 to shareholders on the Brambles register at 5pm on 11 September 2015. The ex-dividend date is 9 September 2015.
Total dividends for the Year were 28.0 Australian cents per share, up 1 Australian cent per share. Brambles paid the 2015 interim dividend of 14.0 Australian cents per share on 9 April 2015.
Brambles 2015 dividends are 30% franked. The unfranked component of the final dividend is conduit foreign income: shareholders not resident in Australia will not pay Australian dividend withholding tax on this dividend.
Brambles’ interest rate risk policy is designed to reduce volatility in funding costs through prudent selection of hedging instruments. This policy includes maintaining a mix of fixed and floating-rate instruments within a target band, over a certain time horizon, sometimes using interest rate derivatives. The policy requires the level of fixed-rate debt to be within 40% to 80% of total forecast debt arising over the immediate 12‑month period, decreasing to a range of: 30% to 70% for debt maturities of one to two years; 20% to 60% for debt maturities of two to three years; 10% to 50% for debt maturities of three to five years and 0% to 50% for debt maturities extending beyond five years.
At 30 June 2015, Brambles had 46% of its weighted average interest-bearing debt over the next 12 months at fixed interest rates (2014: 50%). Beyond 12 months, the proportion of fixed-rate debt in the range of one to two years was: 43% (2014: 54%); 39% for two to three years (2014: 50%); and 19% for three to four years (2014: 40%). The weighted average maturity period of fixed debt was 3.4 years (2014: 3.9 years). The fair value of all interest rate swap instruments was US$10.3 million net gain (2014: US$13.8 million net gain).
Brambles manages its foreign exchange exposures from the perspective of reducing volatility in the value of foreign currency cash flows and assets. Exposures generally arise in either:
-
Transaction exposures affecting the value of transactions translated back to the functional currency of the subsidiary; and
-
Translation exposures affecting the value of assets and liabilities of overseas subsidiaries when translated into US dollars.
Under Brambles’ foreign exchange policy, foreign exchange hedging is mainly confined to the hedging of transaction exposures where such exposures exceed a certain threshold, and as soon as a defined exposure arises. Within Brambles, exposures may arise with external parties or, alternatively, by way of cross-border intercompany transactions. Forward foreign exchange contracts are primarily used for these purposes. Given that Brambles both generates income and incurs expenses in its local currencies of operation, these exposures are not significant. Brambles generally mitigates translation exposures by raising debt in currencies where there are matching assets. During the Year, Brambles maintained net investment hedge borrowings in euro of €350.5 million, broadly to match its euro-denominated assets. At the end of the Year, the fair value of foreign exchange instruments was US$2.7 million net loss (2014: US$0.2 million net loss).
| US$M | Change | |||
|---|---|---|---|---|
| (Continuing operations) | FY15 | FY14 | Actual FX | Constant FX |
| Sales revenue | 5,464.6 | 5,404.5 | 1% | 8% |
| Operating profit | 938.5 | 929.5 | 1% | 8% |
| Significant Items | 47.3 | 30.6 | ||
| Underlying profit | 985.8 | 960.1 | 3% | 10% |
| Underlying Profit margin | 18.0% | 17.8% | +0.2pts | +0.4pts |
| Average Capital Invested | 6,291.0 | 5,889.6 | 7% | 14% |
| Return on Capital Invested | 15.7% | 16.3% | (0.6)pts | (0.5)pts |
| Brambles Value Added[4] | 272.0 | 272.2 | (0.2) | |
| Cash Flow from Operations | 728.8 | 828.2 | (99.4) | |
Brambles' financial results for the 12 months ended 30 June 2015 reflected sales revenue and profit growth from continued execution of the Group's organic growth strategy and contribution from acquisitions made since the start of the prior corresponding period.
The delivery of operating efficiencies resulted in an increase in the Underlying Profit margin, while the modest decline in key return on capital measures reflected the impact of acquisitions.
The variance between actual and constant-currency performance was driven by the strengthening of Brambles' reporting currency, the US dollar, relative to the Group's other operating currencies, particularly the euro.
Sales revenue from continuing operations was US$5,464.6 million, up 1%. Constant-currency sales revenue growth of 8% was in line with guidance of 8% to 9% constant-currency growth for FY15 and the five-year objective for average annual constant-currency percentage sales revenue growth in the high single digits. Constant-currency growth in FY15 was primarily driven by: market-share expansion in the Pallets and RPCs segments; pricing and volume growth in the Pallets segment; and acquisitions in the Containers segment. Excluding the contribution of acquisitions, constant-currency sales revenue growth was 6%.
Underlying Profit, which excludes Significant Items, was US$985.8 million, up 3%. Constant-currency growth of 10% was driven by: sales revenue growth; the delivery of the final US$34 million of efficiencies under the Global Supply Chain program in Pallets; and a reduction in overheads as a proportion of sales revenue. These drivers more than offset: higher plant and transport costs in the USA pooled pallet operations; increased depreciation costs from pool growth in the Pallets and RPCs segments; the increased cost of pallet cores in the USA recycled pallet business; and the recognition within continuing operations of an additional US$10 million of corporate costs (which in FY14, were recharged to the Recall business demerged in December 2013). Excluding acquisitions, constant-currency Underlying Profit growth was 8%.
Return on Capital Invested was 15.7%, down 0.6 percentage points, reflecting the impact of acquisitions made since the beginning of the prior corresponding period. Excluding these acquisitions, Return on Capital Invested was 16.6%, up 0.3 percentage points, as strong profitability gains in the Europe, Middle East & Africa (EMEA) region of the Pallets segment and in the RPCs segment more than offset lower profit in Pallets Americas.
Average Capital Invested was US$6,291.0 million, up 7% (up 14% at constant currency), reflecting acquisitions since the start of the prior corresponding period (Airworld in February 2014, Transpac in June 2014, Ferguson in September 2014 and Rentapack in May 2015). Excluding acquisitions, constant-currency growth was 5%.
Brambles Valued Added was US$272.0 million, down US$0.2 million, reflecting the same trends as for Return on Capital Invested.
Cash Flow from Operations was US$728.8 million, down US$99.4 million, driven by higher capital expenditure.
| US$M | Change | |||
|---|---|---|---|---|
| (Continuing operations) | FY15 | FY14 | Actual FX | Constant FX |
| Underlying Profit | ||||
| Pallets Americas | 416.5 | 435.0 | (4)% | (1)% |
| Pallets EMEA | 343.9 | 326.1 | 5% | 16% |
| Pallets Asia Pacific | 71.6 | 76.4 | (6)% | 3% |
| Total Pallets | 832.0 | 837.5 | (1)% | 6% |
| RPCs | 131.5 | 124.3 | 6% | 15% |
| Containers | 59.3 | 38.0 | 56% | 72% |
| Corporate | (37.0) | (39.7) | 7% | 5% |
| Total Underlying Profit | 985.8 | 960.1 | 3% | 10% |
| Significant Items | (47.3) | (30.6) | ||
| Operating profit | 938.5 | 929.5 | 1% | 8% |
| Net finance costs | (111.9) | (113.0) | 1% | (7)% |
| Tax expense | (241.1) | (232.0) | (4)% | (12)% |
| Profit after tax | 585.5 | 584.5 | 0% | 7% |
| Weighted average number of shares (M) | 1,566.0 | 1,560.7 | 0% | 0% |
| Basic EPS (US cents) | 37.3 | 81.2 | (54)% | (51)% |
| Basic EPS from continuing operations (US cents) | 37.4 | 37.5 | 0% | 7% |
Operating profit of US$938.5 million, was up 1% (up 8% at constant currency). Significant Items of US$47.3 million comprised: restructuring and integration costs of US$34.8 million, $28.0 million of which related to the One Better program; and acquisition-related costs of $12.5 million.
Net finance costs were US$111.9 million, down 1% reflecting lower euro-denominated interest costs as a result of the strengthening US dollar. This more than offset the increase in acquisition-related borrowing costs.
Tax expense was US$241.1 million, up 4%, reflecting profit mix and a higher level of non-deductible acquisition-related costs in FY15. The effective tax rate on operating profit was broadly unchanged at 29%.
Profit after tax of US$585.5 million was flat at actual currency. Constant-currency growth of 7% reflected the increase in operating profit and a modest increase in tax expense.
Basic earnings per share was 37.3 US cents, down from 81.2 US cents in FY14 which included a 43.7 US cent contribution from the non-cash profit associated with the Recall demerger. Basic earnings per share from continuing operations of 37.4 US cents was flat in actual currency terms. Constant-currency growth of 7%, reflected the increase in profit after tax.
Group Sales Revenue (US$M)
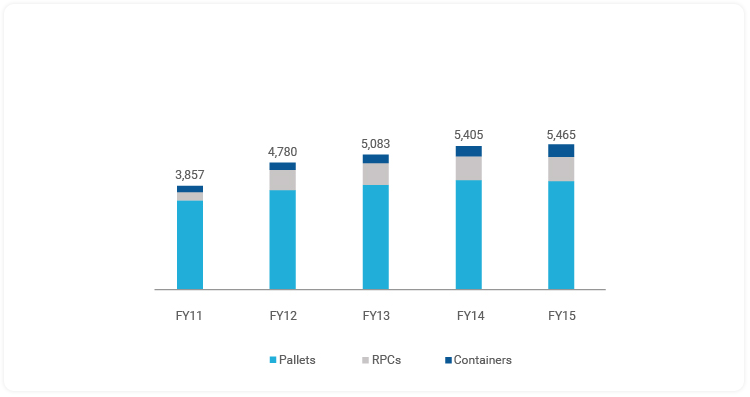
[5] Brambles' sales revenue of US$5,464.6 million in FY15 reflected a five-year compound annual growth rate of 11%[6]. This was delivered despite relatively weak underlying economic conditions in the period. The growth reflected the execution of the Group's strategy: to expand the Pallets business through entering new markets and expanding its products offering; to expand the RPCs operations through the 2011 acquisition of IFCO Systems and ongoing investment in that business to support increased retailer conversions; to increase its presence in the Intermediate Bulk Containers space through acquisitions and continued investment; and diversification through acquisition into new supply chains in the Containers segment such as aerospace and oil and gas .
Underlying Profit (US$M)
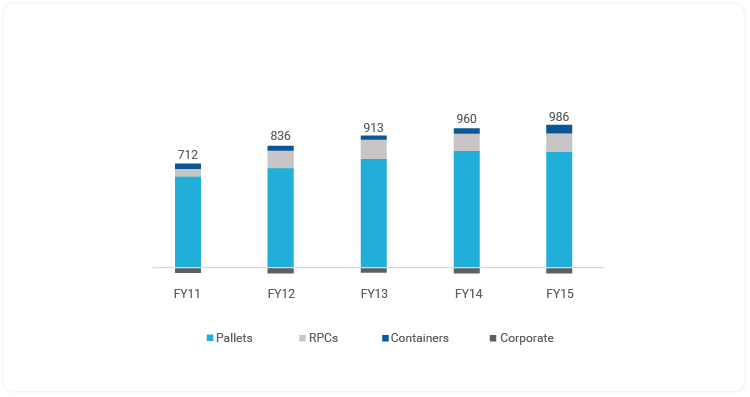
Brambles Underlying Profit of US$985.8 million in FY15 reflected a five-year compound annual growth rate of 12%[6]. The profit growth primarily reflected sales revenue growth as well as the delivery of efficiencies in the Pallets business. Key drivers of profit improvement in the period included: the successful execution of the Better Everyday program to increase pallet and service quality through FY10 to FY13 in the USA pooled pallet operations; the Global Supply Chain program to reduce operating costs by US$100 million from FY12 to FY15, primarily through plant network optimisation; and overall reductions in indirect costs worldwide.
Return on Capital Metrics
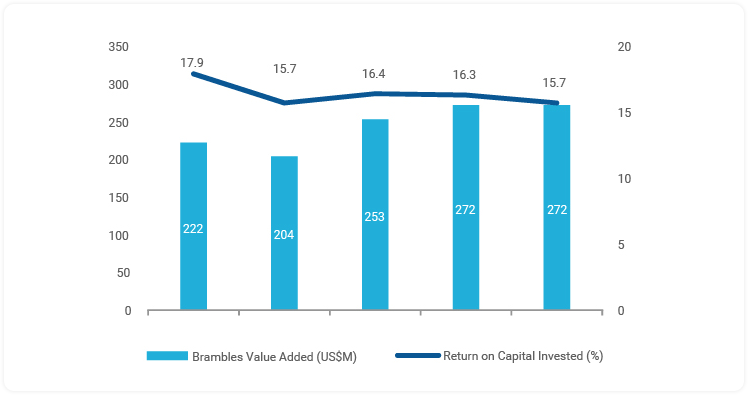
The trend in Brambles' key return on capital metrics (Return on Capital Invested and Brambles Value Added[6]) over the five-year period ended 30 June 2015 reflected the Group's expansion through both organic growth and acquisitions. Return on Capital Invested declined from 17.9% to 15.7% reflecting the impact on capital invested of acquired intangibles. Excluding the impact of acquired intangibles, Return on Capital Invested increased from 20.8% to 22.0%. The trend in Brambles Value Added – a measure of economic profit over and above the cost of capital invested to create that profit – demonstrates how profit growth out-stripped growth in capital, increasing to US$272.0 million in FY15.
Cash Flow from Operations (US$M)
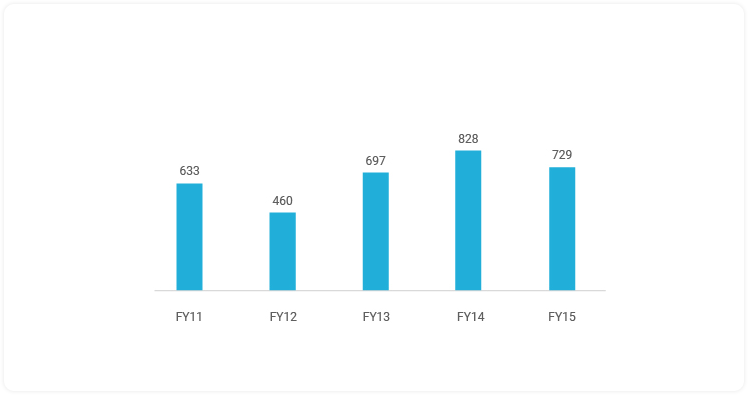
By nature of Brambles' business, Cash Flow from Operations in a given period is largely driven by profitability, capital expenditure and working capital balances. The five years to FY15 was a period of strong profit growth, facilitated largely by significant investments in capital expenditure for growth. In addition, improved asset control practices contributed to reduced replacement capital expenditure relative to sales growth, and working capital efficiencies also contributed positively to cash flow. In FY12, capital expenditure was especially high relative to the size of the business, reflecting growth programs to support expansion in emerging markets of the Pallets business, and in the RPCs segment following the IFCO acquisition.
| US$M | FY15 | FY14 | Change |
|---|---|---|---|
| Underlying Profit | 985.8 | 960.1 | 25.7 |
| Depreciation and amortisation | 549.0 | 528.3 | 20.7 |
| EBITDA | 1,534.8 | 1,488.4 | 46.4 |
| Capital expenditure (cash basis) | (983.6) | (854.3) | (129.3) |
| Proceeds from sale of PP&E | 78.4 | 77.6 | 0.8 |
| Working capital movement | 4.7 | 10.6 | (5.9) |
| IPEP expense | 79.7 | 88.3 | (8.6) |
| Other | 14.8 | 17.6 | (2.8) |
| Cash Flow from Operations | 728.8 | 828.2 | (99.4) |
| Significant Items | (50.9) | (20.9) | (30.0) |
| Discontinued operations | (1.4) | (46.0) | 44.6 |
| Financing costs and tax | (272.4) | (330.4) | 58.0 |
| Free Cash Flow | 404.1 | 430.9 | (26.8) |
| Dividends paid | (359.3) | (394.2) | 34.9 |
| Free Cash Flow after dividends | 44.8 | 36.7 | 8.1 |
Cash Flow from Operations was US$728.8 million, down US$99.4 million. Growth in EBITDA and a positive move in working capital in the second half were insufficient fully to offset the impact of increased capital expenditure to fund growth. Total capital expenditure was US$983.6 million, up US$129.3 million, primarily reflecting investment in the European RPCs and Pallets Americas businesses.
Free Cash Flow after dividends was US$44.8 million, up US$8.1 million, benefiting from: timing of tax and finance costs; non-repetition of costs associated with the Recall demerger; and the favourable translational impact of a strengthening US dollar on Australian dollar dividends. These drivers more than offset the increase in Significant Items relative to FY14.
| US$M | Change | |||
|---|---|---|---|---|
| (Continuing operations) | FY15 | FY14 | Actual FX | Constant FX |
| Sales revenue | 2,357.5 | 2,301.9 | 2% | 5% |
| Operating profit | 399.8 | 419.0 | (5)% | (1)% |
| Significant Items | 16.7 | 16.0 | ||
| Underlying profit | 416.5 | 435.0 | (4)% | (1)% |
| Average Capital Invested | 2,308.1 | 2,251.1 | 3% | 5% |
| Return on Capital Invested | 18.0% | 19.3% | (1.3)pts | (1.1)pts |
| Brambles Value Added | 162.7 | 181.2 | (18.5) | |
Sales
Sales revenue in Pallets Americas was US$2,357.5 million, up 2% (up 5% at constant currency) reflecting: net new business wins in North America; solid pricing growth in the USA recycled pallet and Latin America businesses; and modest like-for-like volume growth throughout the region. The contribution from net new business wins was US$38 million.
-
North America sales revenue was US$2,069.3 million, up 3% (up 4% in constant currency). Within North America:
-
USA pooled pallet revenue was US$1,372.8 million, up 5%, reflecting: new customer contract wins and lane expansion; and rollover benefits from prior-year contract wins. Pricing and like-for-like volume growth contributions were both modest.
-
USA recycled pallet sales revenue was US$422.8 million, up 1%, as pricing growth more than offset a decline in sales volumes driven by contract losses and a shortage of used pallet cores, reflecting an increased demand for pallets to service higher inventory levels in the US retail supply chain.
-
Canada sales revenue was US$273.7 million, down 3%, reflecting the strengthening of the US dollar against the Canadian dollar. Constant-currency sales revenue growth of 7% was primarily driven by rollover benefits from prior-year contract wins.
-
Latin America sales revenue was US$264.1 million, down 3%, reflecting the strength of the US dollar against currencies in the region. Constant-currency growth of 10%, reflected a moderation on prior years. Although volume growth continued, there was a slowdown in the rate of like-for-like volume and net new business growth resulting from lower levels of customer investment in response to increased economic uncertainty.
-
LeanLogistics sales revenue was US$24.1 million, up 9% (up 10% at constant currency) primarily driven by contract wins.
Profit
Underlying Profit was US$416.5 million, down 4% (down 1% at constant currency). Volume growth in the USA pooled pallet and Canada businesses, the delivery of US$16 million of efficiencies under the Global Supply Chain program and flat overheads were insufficient to offset higher direct costs in the USA pooled pallet business and core-price inflation in the USA recycled pallet business.
In constant-currency terms, direct cost increases were driven by:
-
A US$40 million increase in plant and transportation costs in the USA pooled pallet business, resulting from improved asset management practices and an increased damage rate associated with higher asset utilisation. The business has commenced implementing durability improvements to new and existing pallets which, over time, are expected to reduce the damage rate in the US pallet pool.
-
A US$15 million increase in transport carrier rates in the USA pooled pallet business, resulting from supply shortages for third-party road freight amid regulatory changes and tightened labour supply in the sector. Transportation surcharges introduced in February 2015, slightly offset this inflation in the second half.
-
A US$14 million increase in depreciation costs, in line with the growth in the pallet pool to resulting from increased pallet demand in the USA and expansion in Latin America.
Operating profit of US$399.8 million was down 5% (down 1% at constant currency). Significant Items of US$16.7 million primarily related to the One Better program and the first phase of the CHEP brand refresh project.
Return on Capital
Return on Capital Invested was 18.0%, down 1.3 percentage points (down 1.1 percentage points at constant currency), reflecting the reduction in Underlying Profit and increased Average Capital Invested. Capital expenditure[7] was US$379.6 million, up $36.0 million, largely reflecting increased customer cycle times in the USA, resulting from retail supply-chain restocking.
| US$M | Change | |||
|---|---|---|---|---|
| (Continuing operations) | FY15 | FY14 | Actual FX | Constant FX |
| Sales revenue | 1,380.5 | 1,458.6 | (5)% | 5% |
| Operating profit | 341.8 | 327.3 | 4% | 15% |
| Significant Items | 2.1 | (1.2) | ||
| Underlying profit | 343.9 | 326.1 | 5% | 16% |
| Average Capital Invested | 1,253.0 | 1,330.3 | (6)% | 6% |
| Return on Capital Invested | 27.4% | 24.5% | 2.9pts | 2.4pts |
| Brambles Value Added | 210.9 | 168.2 | 42.7 | |
Sales
Sales revenue in Pallets EMEA was US$1,380.5 million, down 5%, largely driven by the strengthening of the US dollar against the euro and, to a lesser extent, the pound. Constant-currency growth of 5%, reflected broadly equal contributions from pricing, like-for-like volume growth and net new business wins of US$23 million.
-
Europe sales revenue was US$1,228.1 million, down 6% (up 4% at constant currency). Within Europe:
-
Mid Europe (comprising Germany, Italy, the Benelux region, Scandinavia, Switzerland and Austria) sales revenue was US$368.3 million, down 9%. Constant-currency growth of 3% was primarily driven by continued expansion with new and existing customers;
-
UK & Ireland sales revenue was US$363.9 million, down 3%. Constant-currency growth of 1% was driven by new contract wins and pricing growth, which more than offset the impact of contract losses resulting from aggressive price-based competition;
-
Iberia was US$234.7 million, down 8%. Constant-currency growth of 4% represented solid pricing and net new business growth as well as improved like-for-like volume growth, in line with economic recovery in the region;
-
France sales revenue was US$158.6 million, down 10%. Constant-currency growth of 2% reflected modest like-for-like volume growth; and
-
Central & Eastern Europe sales revenue was US$102.6 million, up 5% (up 20% at constant currency) driven by continued strong new business growth.
-
Africa, India & Middle East sales revenue was US$152.4 million, up 5% (up 13% at constant currency), primarily driven by like-for-like volume growth and price increases.
Profit
Underlying Profit was US$343.9 million up 5%. Constant-currency growth of 16% was primarily driven by: the delivery of US$15 million of efficiencies under the Global Supply Chain program; sales mix improvements resulting from changes in the customer portfolio; specific pricing initiatives; and other direct cost efficiencies. Operating profit was US$341.8 million, up 4% (15% at constant currency). Significant Items of US$2.1 million primarily reflected One Better-related costs.
Return on Capital
Return on Capital Invested was 27.4%, up 2.9 percentage points (2.4 percentage points at constant currency) reflecting increased profitability. Capital expenditure was US$256.0 million, down US$16.3 million. At constant currency, capital expenditure was up US$16.0 million to fund growth with key customers in the region.
| US$M | Change | |||
|---|---|---|---|---|
| (Continuing operations) | FY15 | FY14 | Actual FX | Constant FX |
| Sales revenue | 343.5 | 362.9 | (5)% | 3% |
| Operating profit | 70.6 | 75.8 | (7)% | 3% |
| Significant Items | 1.0 | 0.6 | ||
| Underlying profit | 71.6 | 76.4 | (6)% | 3% |
| Average Capital Invested | 357.1 | 371.9 | (4)% | 2% |
| Return on Capital Invested | 20.1% | 20.5% | (0.4)pts | 0.3pts |
| Brambles Value Added | 35.1 | 33.1 | 2.0 | |
Sales
Sales revenue in Pallets Asia-Pacific was US$343.5 million, down 5%, primarily driven by the strengthening of the US dollar against the Australian dollar. Constant-currency growth of 3% largely reflected robust pricing gains in Australia and continued expansion with new and existing customers in Asia. The contribution from net new business wins was US$3 million.
-
Australia & New Zealand sales revenue was US$297.7 million, down 7% (up 2% at constant currency).
-
China sales revenue was US$28.7 million, up 5%, reflecting continued growth in wooden pallet volumes as China transitions volumes away from the legacy plastic pallet business.
-
South-East Asia sales revenue was US$17.1 million, up 7% (up 11% at constant currency) reflecting solid like-for-like volume growth.
Profit
Underlying Profit was US$71.6 million, down 6%. Constant-currency growth of 3% largely reflected the pricing component of sales revenue in Australia and Global Supply Chain program efficiencies of US$3 million. Operating profit was US$70.6 million, down 7% (up 3% in constant currency). Significant Items of US$1.0 million primarily related to the One Better program.
Return on Capital
Return on Capital Invested was 20.1%, down 0.4 percentage points. At constant currency, Return on Capital Invested improved by 0.3 percentage points reflecting Underlying Profit growth. Capital expenditure was US$61.6 million, up US$4.2 million primarily reflecting ongoing investment in infrastructure and assets to support growth in Asia.
| US$M | Change | |||
|---|---|---|---|---|
| (Continuing operations) | FY15 | FY14 | Actual FX | Constant FX |
| Sales revenue | 917.6 | 895.8 | 2% | 12% |
| Operating profit | 130.8 | 124.3 | 5% | 15% |
| Significant Items | 0.7 | - | ||
| Underlying profit | 131.5 | 124.3 | 6% | 15% |
| Average Capital Invested | 1,541.2 | 1,573.2 | (2)% | 6% |
| Return on Capital Invested | 8.5% | 7.9% | 0.6pts | 0.7pts |
| Brambles Value Added | (53.9) | (64.2) | 10.3 | |
Sales
Sales revenue in RPCs was US$917.6 million, up 2% reflecting the strengthening of the US dollar against the other key operating currencies. Constant-currency growth of 12% was largely driven by continued expansion with existing retail customers in Europe and North America as well as significant contributions from recent contract wins with large European retailers.
-
Europe sales revenue was flat at US$582.4 million. Constant-currency growth of 12% reflected strong volume growth with large retailers such as Rewe, Waitrose, Carrefour and Dia.
-
North America sales revenue was US$191.5 million, up 10%, reflecting continued conversions with existing retail partners including Walmart, Kroger and Loblaws.
-
Australia, New Zealand and South Africa sales revenue was US$117.4 million, down 1%. Constant-currency growth of 9%, primarily reflected increased conversions with existing retailers in South Africa and Australia.
-
South America sales revenue of US$26.3 million was up 20% (up 44% at constant currency) and included a one-month contribution from Rentapack, the leading provider of RPC pooling services in Chile, acquired in May 2015. Excluding the impact of this acquisition, constant-currency sales revenue growth was 33%, reflecting strong pricing growth and continued expansion with existing retailers in Brazil and Argentina.
Profit
Underlying Profit was US$131.5 million, up 6%. Constant-currency growth of 15% primarily reflected: sales revenue growth; scale-related network and transportation efficiencies in Europe; and the absence of one-off retirement payments, impairment charges and marketing costs incurred in the prior year. These benefits more than offset higher depreciation costs in line with growth of the RPC pool and a modest increase in other direct costs. Operating profit was US$130.8 million, up 5% (up 15% at constant currency). Significant Items of US$0.7 million largely related to the One Better program.
Return on Capital
Return on Capital Invested was 8.5%, up 0.6 percentage points (up 0.7 percentage points at constant currency), driven by Underlying Profit growth. Capital expenditure was US$238.3 million, up US$57.9 million, primarily reflecting continued equipment purchases to support growth in all regions.
| US$M | Change | |||
|---|---|---|---|---|
| (Continuing operations) | FY15 | FY14 | Actual FX | Constant FX |
| Sales revenue | 465.5 | 385.3 | 21% | 31% |
| Operating profit | 58.1 | 35.9 | 62% | 79% |
| Significant Items | 1.2 | 2.1 | ||
| Underlying profit | 59.3 | 38.0 | 56% | 72% |
| Average Capital Invested | 874.1 | 431.2 | 103% | 119% |
| Return on Capital Invested | 6.8% | 8.8% | (2.0)pts | (1.9)pts |
| Brambles Value Added | (49.0) | (14.0) | (35.0) | |
Sales
Sales revenue in the Containers segment was US$465.5 million, up 21% (up 31% at constant currency), primarily reflecting the contribution from businesses acquired since the start of the prior corresponding period (Ferguson, Transpac and Airworld). Excluding acquisitions, constant-currency sales revenue growth was 4% as solid underlying growth in the Intermediate Bulk Containers and Aerospace businesses more than offset the impact of challenging operating conditions in the Automotive and CHEP Catalyst & Chemical Containers businesses.
By business line, Containers’ sales revenue was as follows:
-
Automotive sales revenue was US$147.3 million, down 9%, reflecting the US dollar strength against the Australian dollar and the euro. Constant-currency sales revenue was down 1% as contributions from new contract wins with General Motors in North America, continued growth in India and an improved second-half performance in Europe were insufficient to offset the ongoing decline of the Australian automotive industry and challenging first-half conditions in Europe.
-
Intermediate Bulk Containers sales revenue was US$129.5 million, up 11% (up 22% at constant currency), reflecting the full-year contribution from the Transpac business acquired in June 2014 and solid underlying growth in all regions. Excluding acquisitions, constant-currency sales revenue growth was 9%.
-
Oil & Gas sales revenue was US$110.9 million, up 168% (up 193% at constant currency), reflecting the US$74.1 million contribution from the Ferguson business acquired in September 2014. In the 12 months ended 30 June 2015, for nine months of which it was under Brambles ownership, Ferguson delivered constant-currency sales revenue growth of 7% as growth in Australia, the UK, the Middle East and Africa more than offset the adverse impact of challenging industry condition on activity levels in Singapore and Norway, particularly in the second half. Sales revenue in Brambles' pre-existing CHEP Catalyst & Chemical Containers business declined 11% (down 5% at constant currency) as an improved second-half performance in the Europe, Middle East & Africa region was insufficient to offset the impact of customers' continued deferral of refinery maintenance in the USA and Canada.
-
Aerospace sales revenue was US$77.8 million, up 19% (up 25% at constant currency), largely driven by the full-year contribution from the Airworld business acquired in February 2014. Excluding acquisitions, constant-currency growth was 14%, reflecting a strong second-half performance as the pooling contract with Cathay Pacific and key maintenance contract wins with Singapore Airlines and Air France became active.
Profit
Underlying Profit was US$59.3 million, up 56% (up 72% in constant currency), primarily reflecting the contribution from the Ferguson acquisition. Excluding the impact of acquisitions, Underlying Profit was US$36.3 million, down 2%, reflecting the strengthening of the US dollar. Constant-currency growth was 10%, reflecting sales growth and scale efficiencies. Operating profit was US$58.1 million, up 62% (up 79% in constant currency). Significant Items of US$1.2 million primarily related to acquisitions and the One Better program.
Return on Capital
Return on Capital Invested was 6.8%, down 2.0 percentage points, reflecting the increase in Average Capital Invested from acquisitions. Excluding the impact of acquisitions, Return on Capital Invested was 8.9%, up 0.2 percentage points (up 0.6 percentage points at constant currency) reflecting profit growth. Capital expenditure was US$101.0 million, up US$46.9 million primarily to support growth, particularly with new customers in Aerospace and acquisitions.